
Boston|U.S.A.
Statistische Daten
Google-Einträge für Boston 507.000.000
Google-Einträge pro Einwohner (Stadtgebiet) 811,08
Stadtgründung 1630
http://en.wikipedia.org/wiki/History_of_Boston#Founding
Fläche Stadtgebiet 232,14 km²
davon Landfläche 125.43 km²
Metropolgebiet 11.683 km²
http://en.wikipedia.org/wiki/Boston
KLIMA
Max. Temperatur Ø (°C) 15,1
Min. Temperatur Ø (°C) 6,5
Niederschlag / Jahr (mm) 1.054,3
Regentage 98,7
http://de.wikipedia.org/wiki/Boston
BEVÖLKERUNG (2012)
Stadtgebiet 625,087
Metropolgebiet 4,59 Mio.
http://en.wikipedia.org/wiki/Boston
Bevölkerungsentwicklung (Stadt)
1950 801.444
1960 697.197
1970 641.071
1980 562.994
1990 574.283
2000 589.141
2010 617.594
2012 625.087
http://en.wikipedia.org/wiki/Boston
Bevölkerungsdichte (Einwohner/km²)
Stadtgebiet 4.983,5
http://en.wikipedia.org/wiki/Boston
Ethnische Zusammensetzung (2010)
Weiße (nicht-hispanisch) 47%
davon irischen Ursprungs 15,8% italienischen Ursprungs 8,3%
Schwarze 24,4%
Hispanos / Latinos 17,5%
Asiaten 8,9%
zwei- oder mehrrassig 3,9%
Ureinwohner 0,4%
http://quickfacts.census.gov/qfd/states/25/2507000.html
WIRTSCHAFT
GDP (Metropolgebiet, 2012) 320,7 Mrd. US-Dollar [1]
GDP per capita (Metropolgebiet, 2012) 69.308 US-Dollar [1]
Anteil am nationalen GDP 2,04% [2]
Bevölkerungsanteil an der US-Bevölkerung 1,47% [2]
[1] http://www.brookings.edu/research/interactives/global-metro-monitor-3
[2] http://www.brookings.edu/~/media/Multimedia/Interactives/2013/tentraits/Boston.pdf
Since 2002, the city of Boston has been ranked number 1 in the world in science and technology and number 4 in patent applications. The city’s specialization in sectors such as computers and electronics, business services, chemicals, and royalties enabled it to increase its exports by 12 percent between 2009 and 2010 and to climb from 83rd to 25th place in the ranking of top exporting U.S. cities. Since 2009, Boston’s economy has grown at a rate of 4.8 percent, the highest among all major U.S. metropolitan areas. Though approximately 10 percent of the population of Massachusetts lives in Boston, the city is home to 18 percent of all jobs in the state. In 2011, Boston was ranked the most innovative city in the world, as the U.S. city with the best Internet connectivity, and as the third best U.S. city in terms of quality of life, after Honolulu and San Francisco.
http://www.brookings.edu/~/media/Multimedia/Interactives/2013/tentraits/Boston.pdf
Größte Arbeitgeber nach Sektoren (Auswahl, Stadtgebiet, 2011)
Arbeitsplätze gesamt 674,919
davon
Hospitals 85,928
Finanzen und Versicherungen 79.513
Professional, Scientific, and Technical Services 77.639
Government 77.468
Accommodation and Food Services 53.702
Colleges and Universities 46.705
Retail Trade 31.092
zum Vergleich
Manufacturing 9.372
http://www.bostonredevelopmentauthority.org/PDF/ResearchPublications/Economy%20Report%202013-FINAL.pdf
Durchschnittsstundenlöhne nach Beschäftigungsgruppen in US-D (2012)
Insgesamt, alle Beschäftigungszweige 28.05
Lawyers 65.63
General and operations managers 63.26
Management analysts 50.48
Software developers, applications 49.61
Registered nurses 40.88
Construction labourers 24.15
Production labourers 18,94
Office clerks, general 16.57
Waiters and waitresses 13.17
Retail salespersons 12.79
Cashiers 10.36
Cooks, fast food 10.17
http://www.bls.gov/ro1/blssummary_boston.pdf
Arbeitslose in Prozent (Juli 2013)
Boston (Metropolgebiet) 6,6
Boston (Stadt) 7,6
USA 7,7
http://www.bls.gov/ro1/blssummary_boston.pdf
Zwangsversteigerungen von Einfamilienhäusern im Großraum Boston
2003 25
2005 180
2007 2.061
2008 3.055
2010 3.015
2011 2.146
http://www.northeastern.edu/dukakiscenter/wp-content/uploads/2012_Housing_Report_Card.pdf
Mindestlohn
Mindestlohn (2013) 8 USD [1]
Jahresverdienst bei Mindestlohnbezug 16.640 USD [1]
Bezieher von Mindeslöhnen oder darunter (Mass., 2012) 62.000 [2]
davon weniger als Mindeslohn 45.000 [2]
[1] http://www.wbur.org/2013/03/20/two-bed-apartment-minimum-wage
[2] http://www.bls.gov/ro1/minwage.htm
Low-wage jobs are fast replacing middle-class ones in the U.S. economy. Sixty percent of the jobs lost in the last recession were middle-income, while 59 percent of the new positions during the past two years of recovery were in low-wage industries that continue to expand such as retail, food services, cleaning and health-care support. By 2020, 48 percent of jobs will be in those service sectors.
http://www.bloomberg.com/news/2013-06-19/the-capitalist-s-case-for-a-15-minimum-wage.html
Kaufkraftverlust des Mindestlohnes seit 1968 25%
Der Mindestlohn müsste betragen bei zu Grunde gelegter
Inflation seit 1968 10,72 USD
Einkommenssteigerung der 10% Einkommensstärksten seit 1979 13,67 USD
Produktivitätssteigerung seit 1979 19,77 USD
http://www.massbudget.org/report_window.php?loc=labor_day_2013.html
Lohnungleichheit (2009)
die 5% Einkommensstärkesten verdienten 25% des Gesamteinkommens
die 20% Einkommensschwächsten verdienten 2,2% des Gesamteinkommens
mehr als 1/3 der farbigen Familien verdiente weniger als 25.000 USD / Jahr
1/10 der farbigen Familien verdiente weniger als 10.000 USD / Jahr
fast die Hälfte der weißen Familien verdiente mehr als 100.000 USD / Jahr
1/10 der weißen Familien verdiente weniger als 25.000 USD / Jahr
http://www.tbf.org/~/media/TBFOrg/Files/Reports/Final%20Poverty%20report.pdf
Boston’s recent economic dynamism reflects an increase in wealthy, well-educated residents rather than a decline in poverty, with widening inequality and stark racial/ethnic disparities.
http://www.tbf.org/~/media/TBFOrg/Files/Reports/Final%20Poverty%20report.pdf
Gewerkschaftsmitgliedschaft (Massachusetts, 2012)
Mitglieder 410.000
in % aller Beschäftigten 14,4%
http://www.bls.gov/ro1/mactum.htm
Geringverdiener
Wieviel müssen Geringverdiener bei verschiedenen angelegten Standards in der Stunde verdienen (2010, kalkuliert für eine vierköpfige Familie, Eltern beide vollzeitbeschäftigt)
Federal Poverty Level 10,60 USD
Social Inclusion 14,94 USD
(definiert als 2/3 des Median-Stundenlohnes)
Family Economic Self-Sufficiency Standard 16,15 USD
(definiert als Bedarf zur Befriedigung der Grundbedürfnisse
ohne staatliche Unterstützung)
http://works.bepress.com/cgi/viewcontent.cgi?article=1010&context=susan_moir
Geringverdiener in Boston
(Metropolgebiet, nach Family Economic Self-Sufficiency Standard, 2005-2009)
gesamt 798.496
in Prozent aller Beschäftigten 41%
davon
im Privatsektor 633.623
im öffentlichen Sektor 73.591
Selbständige 77.767
http://works.bepress.com/cgi/viewcontent.cgi?article=1010&context=susan_moir
Anteil von Geringverdienenden in ausgewählten Bereichen
Hotel- / Gastgewerbe 76%
Handel 62%
Erziehung 43%
Produzierendes Gewerbe 28%
Baugewerbe 37%
Kultur, Unterhaltung, Erholung 71%
Finanzen und Versicherungen 19%
Öffentliche Verwaltung 21%
http://works.bepress.com/cgi/viewcontent.cgi?article=1010&context=susan_moir
Sequestration
Sequestration – Automatische Bundes-Etatkürzungen gemäß Budget Control Act von 2011
Wirksam seit März 2013 [1]
Umfang USA gesamt 1,1 Billionen USD bis 2021 [1]
Umfang USA 2013 (Fiskaljahr bis 30.09.2013) 85 Mrd. USD [2]
[1] http://en.wikipedia.org/wiki/Budget_sequestration_in_2013
[2] http://www.huffingtonpost.com/2013/03/01/obama-sequester-order_n_2793653.html
We’re not only the Bay State, we’re the Brain State, and that did not happen by chance,” Markey said in an interview. “It’s in large part due to federal funding that supports our leading researchers and scientists and innovative bio-tech companies, and federal funding that supports our education programs, and the billions of dollars our hospitals receive to train the next generation of doctors. The massive arbitrary cuts threaten Massachusetts’ role as the nation’s high tech, bio tech, clean tech hub.
http://www.boston.com/politicalintelligence/2013/02/15/massachusetts-will-lose-jobs-congress-enacts-sequestration-report-says/zcJBA7HgAGE7rbr8KU6xUI/story.html
Auswirkungen der Etatkürzungen auf Massachusetts in Bezug
auf Lehrer und Schulen in 2013
Kürzungen bei Primär- / Sekundärschulen 13.9 Mio. USD
dadurch gefährdete Personalstellen 190
Kürzungen bei Schulen für behinderte Kinder 13.4 Mio. USD
dadurch gefährdete Personalstellen 160
http://www.washingtonpost.com/wp-srv/special/politics/sequestration-state-impact/
Auswirkungen der Etatkürzungen auf Massachusetts in Bezug
auf Wohnungsprogramme für einkommensschwache Haushalte in 2013
Subventionsprogramme für Wohnungsbau minus ca. 5% (-5.745.593 USD)
Housing Choice Vouchers (Mietunterstützung) minus ca. 5% (- 3.847 geförderte Haushalte)
Public Housing minus ca. 5% (- 9.551.642 USD)
Obdachlosenunterstützung minus ca. 5% (- 3.584.945 USD)
Wohn-Unterstützung für AIDS-Kranke minus ca. 5% (- 206.084 USD)
http://www.cbpp.org/files/1-28-13hous.pdf
Auswirkungen der Etatkürzungen z.B. auf das „HomeBASE“-Programm
der Metropolitan Boston Housing Partnership (MBHP)
jährliche HomeBase-Aufwendungen 19 Mio.
betreute Familien in Boston (Stadt) 1.030 (Massachusetts: 5.000 Familien)
durchschnittliches Familieneinkommen 10.140 USD / Jahr
das zur Anmietung eines Apartments (2 Schlafzimmer) 49.512 USD / Jahr
Zu Marktpreisen in Boston nötige Einkommen
Mietkosten oberhalb des Monatseinkommens 85% der Familien
mehr als die Hälfte der Familien verlieren die Unterstützung bis Dez. 2013
alle Familien verlieren die Unterstützung bis Juni 2014
http://www.mbhp.org/HomeBASE%20Report_Final.pdf
There are a huge number of families, about 200,000 in Massachusetts, with income so low they qualify for emergency assistance. Families with income of $18,000 for a family of three qualify for emergency assistance. [...] 90,000 families have housing vouchers, either section 8 or Massachusetts Rental Voucher Program (5900 families). Housing is very expensive in Massachusetts. Apartment rent would require 85% of income in greater Boston for a family at the EA limit, and 65% of income outside greater Boston. [...] The number of homeless families in motels has nearly tripled in the last four years, increasing from 600 to nearly 1700 in December 2012.
http://www.endfamilyhomelessness.net/statistics
ARMUT
Federal Poverty Line (FPL, 2013)
Einzelperson $11.490 / Jahr
Vierköpfige Familie $23.550 / Jahr
http://www.medicaid.gov/Medicaid-CHIP-Program-Information/By-Topics/Eligibility/Downloads/2013-Federal-Poverty-level-charts.pdf
Bostonians unterhalb der Armutsgrenze (2005 - 2009)
Gesamt 19%
Familien mit Kindern 23%
Kinder 28%
Latino-Kinder 40%
schwarze Kinder 35%
asiatische Kinder 31%
weiße Kinder 9,5%
http://forwardwithfelix.com/wp-content/uploads/2013/09/Pathways-out-of-Poverty.pdf
Haushalte unterhalb der Armutsgrenze (Stadtgebiet, 2010) 21,2%
Kinder unterhalb der Armutsgrenze (Stadtgebiet, 2010) 30,5%
http://www.bostonredevelopmentauthority.org/PDF/ResearchPublications//2012%20Boston%20by%20the%20Numbers-%20Children.pdf
LEBENSHALTUNGSKOSTEN
Preise (in EUR)
12 Eier 1,90,-
1 kg Tomaten 2,91,-
Brot für 2 Personen (1 Tag) 1,86,-
0,5 Liter Bier im Supermarkt 2,13,-
1 Liter Vollmilch 1,82,-
Stundenlohn Putzhilfe 35,-
Monatsmiete für eine 85 qm-Wohnung
in einem teuren Stadtviertel 1.965,-
1 Liter Benzin 0,72,-
Monatskarte ÖPNV 54,-
http://www.expatistan.com
Monatliche Lebenshaltungskosten für
eine vierköpfige Familie (Metropolgebiet, in US-Dollar 2013)
Wohnen $ 1.444
Nahrung $ 754
Kinderbetreuung $ 1.505
Transport $ 607
Gesundheitsvorsorge $ 1.585
Andere $ 563
Steuern $ 751
Gesamt Monat $ 7.209
Gesamt Jahr $ 86.502
http://www.epi.org/resources/budget
It takes more income for a family to be self-sufficient in Massachusetts than almost anywhere else. Factoring the costs of day care, housing, utilities, and food, the Crittenton Women’s Union estimates that a mother with two young children would need $65,880 to meet basic expenses without relying on any state subsidies. That’s an eye-popping $31.55 an hour.
http://www.bostonglobe.com/opinion/2013/06/17/what-wage-worth/DPJQRnv6skJw7k7nRMOGmJ/story.html
Verlangte Durchschnittsmiete bei Neuvermietungen
für Apartment (2 Schlafzimmer) in USD (12 / 2011) in bestimmten Vierteln, z.B.
East Boston $ 1.689
Cambridge $ 2.462
Seaport $ 3.144
Durchschnitt $ 2.126
http://static.rentjuice.com/rj_index/BostonIndex-4Q2011.pdf
Mieten in Greater Boston (2010)
mehr als 50% aller Mieter zahlen mehr als 30% ihres Einkommens für Miete
25% aller Mieter zahlen mehr als 50% ihres Einkommens für Miete
http://www.northeastern.edu/dukakiscenter/wp-content/uploads/2012_Housing_Report_Card.pdf
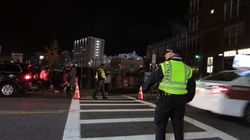
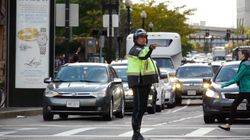
VERKEHR
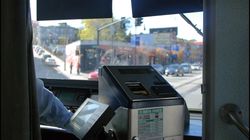
ÖPNV Massachusetts Bay Transportation Authority (MBTA)
Die MBTA ist das fünftgrößte ÖPNV-Unternehmen der USA und bedient ca. 4,8 Mio. Einwohner. Sie und betreibt im Metropolgebiet Boston13 Eisenbahnlinien, 3 U-Bahnlinien, 5 Straßenbahnlinien, 4 Oberleitungsbuslinien und 183 Omnibuslinien, davon 2 als Rapid-Bus-Transit. [1]
beförderte Passagiere 2012 404.788.328 [2]
pro typischem Werktag 1.311.149 [2]
[1] http://www.mbta.com/about_the_mbta/history/default.asp?id=970
[2] http://www.mbta.com/uploadedfiles/About_the_T/Financials/14-18%20Final%20CIP.pdf
Modal Split (2009)
Auto 45%
ÖPNV 35%
Fuß 14%
Fahrrad 2%
http://www.rad-spannerei.de/blog/2013/01/28/modal-split-in-millionenstaedten/
Registrierte Fahrzeuge
2008 362.288 (Einwohner, 609.023)
2013 311.943 (Einwohner, 636.479; geschätzt)
http://www.boston.com/business/graphics/registered_vehicles_in_boston
Boston reduziert die Auflagen zur Anlage von Parkplätzen bei Bauvorhaben
„The facts are that the young people who are the surge of the population growth in the city have fewer cars — interestingly, fewer licenses as well. And they care deeply about their carbon footprint. And so a lot of them instinctively are doing something that people in my generation didn’t do, and that is they don’t have a car and they feel no need for a car. Or they rent a car when they need it, and they take public transportation, walk or bike to work.“
Peter Meade, Direktor der Boston Redevelopment Authority http://www.wbur.org/2013/07/05/bra-parking-spaces